
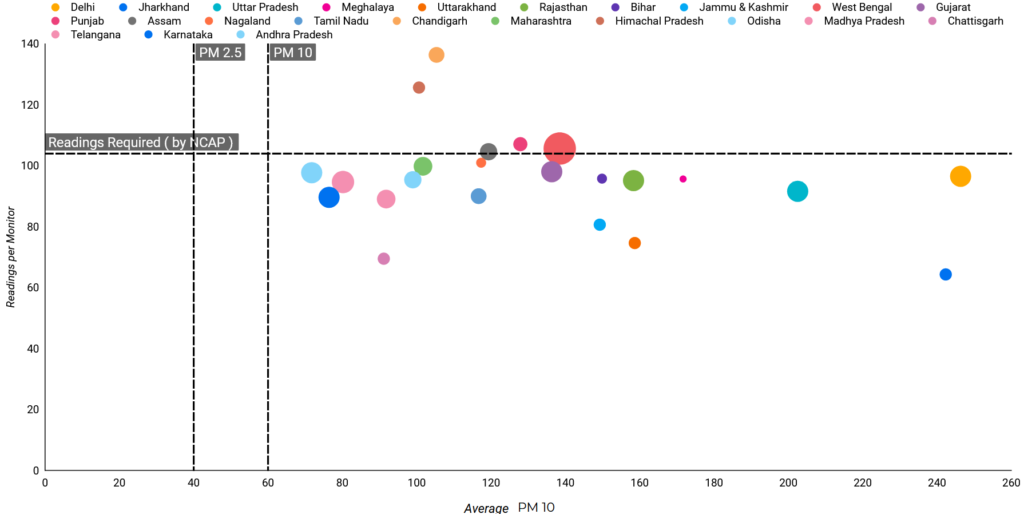
A week after the State of Global Air 2020 revealed that India had faced the highest exposure to toxic air in the world last year, a new dashboard now delves deeper into Indian states’ and cities’ air pollution mitigation efforts. According to data compiled across 23 states and 122 cities featured in India’s National Clean Air Programme (NCAP), Delhi, unsurprisingly ranked as the most polluted state on average PM10 monitoring data from 2016 to 2018. Meanwhile, out of the 23 states listed in the NCAP with non-attainment cities, only 3 states, Himachal Pradesh, Chandigarh and Punjab, accounted for above average readings for all 3 years of PM10 monitoring.
Carbon Copy’s National Air Quality Monitoring Programme (NAMP) dashboard is built on data from the Central Pollution Control Board’s National Ambient Air Quality Monitoring (NAAQM) Network which was started in 1984-85 and covers 344 cities/towns in 29 states and 6 UTs. Under the NAMP, each station records about 104 observations a year covering four pollutants– Sulphur dioxide (So2), nitrogen dioxide (No2), suspended particulate matter (SPM), and respirable suspended particulate matter (RSPM). While state pollution control boards and the National Environmental Engineering Research Institute (NEERI), Nagpur carry out the monitoring, the Union environment ministry oversees the operation under the NCAP.
How India’s states and cities stack up
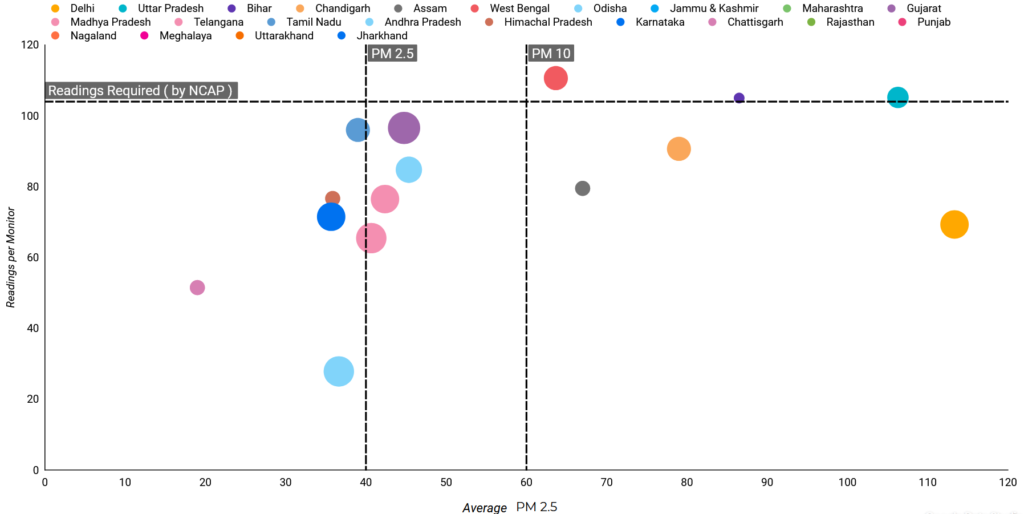
Following Delhi as the worst-ranked state in terms of PM10 pollution are Jharkhand and Uttar Pradesh. As for cities, Ghaziabad topped with the worst PM10 level average across 3 years at 253, followed by Delhi at 246 and Dhanbad at 242. Dehradun ranked 4th, followed by Bareilly, Lucknow, Firozabad, Silchar, Noida and Kanpur. In terms of PM2.5 levels, Noida ranked the worst with 119 µg/m3, followed by Agra, Delhi, Lucknow, Ghaziabad, Muzzaffarpur, Kanpur, Chandigarh, Howrah and Kolkata at 10th.
While PM10 levels in Delhi showed a year-on-year decrease with 274 in 2016, decreasing to 225 in 2018, PM2.5 levels did not fare so well. PM2.5 levels in Delhi improved by 14% in 2017, in comparison to 2016 levels, but in 2018 PM2.5 levels increased by 21% to an all-time high of 121 despite the decreased number of readings counted for that year. In neighbouring Uttar Pradesh, which is also one of the country’s worst performing states, PM10 levels in state-capital Lucknow in 2016 was recorded at 214, in 2017 it was 244 and in 2018 it was recorded at 217. PM2.5 levels in the city also recorded a 6% increase between 2017 and 2018. In Agra, which incidentally has the maximum number of PM2.5 monitors in the state, saw a 15% improvement in PM2.5 levels from124 micrograms/cubic metre in 2017 to 105 in 2018.
Maharashtra, which has the maximum number of non-attainment cities in the NCAP, has also seen air quality worsen since 2016. State capital, Mumbai, for instance witnessed a year-on-year increase in PM10 levels from 119 in 2016, to 151 in 2017 and 165 in 2018. Chandrapur, one of the critically polluted clusters in the country, witnessed an unexplained drop in PM10 levels in 2017 to 4, while it measured 111 in 2016 and shot back up to 149 in 2018. Other polluted cities like Latur, Nagpur, Nashik, Pune, Sangli and Solapur also observed increases in PM10 levels in 2018 in comparison to 2017 levels.
On a positive note, Tuticorin in Tamil Nadu has recorded progressive and substantial improvements in PM10 levels between 2016 and 2018- by 24% in 2017, in comparison to 2016 levels, and another 23% in 2018 in comparison to the previous year.
Gaps persist
Despite expansions in the country’s air pollution monitoring network, data is still scarce, especially with regards to PM2.5 levels. Out of 23 states listed under the NCAP, only 17 states had any PM2.5 manual data monitoring available from 2016-2018. West Bengal ranked with the highest number of average 110 readings per year. The average readings required for monitoring purposes are 104 per year per monitor. Uttar Pradesh and Bihar followed with 105 readings, and Gujarat and Maharashtra with 96 avg readings each. Andhra Pradesh fared worst with 27 readings, followed by Chhattisgarh, Telangana, Delhi and Karnataka. Of the 122 NCAP cities, only 59 had PM2.5 data available at all.
Despite the lofty promises made by PM Narendra Modi to clean up Varanasi, his Parliamentary Constituency does not fare well in terms of air quality monitoring. Varanasi ranks fifth lowest in terms of monitoring data/readings for a 3-year average for PM10 levels. Across the state, Congress President Sonia Gandhi’s Parliamentary constituency, Rae Bareily, ranked 10th lowest. While Dehradun emerged as the worst performer, just behind it is Srinagar.
But it isn’t just gaps in observation that hinder assessment of air quality in the country. Crucially, while gradual increase in monitoring efforts across the country show PM trends, the NAMP monitoring system changed in 2019 to capture AQI data instead of PM2.5/PM10 levels. This change makes it complicated to draw comparisons from previous years’ data. Further, NAMP monitoring has largely been discontinued after 2018 and in its place Continuous Ambient Air Quality Monitoring Stations (CAAQMS) installation has been underway over the past two years. This shift has added to the complication of drawing comparisons with 2017- especially as it is considered the base year for the National Clean Air Program.
Selected NCAP budget highlights:
Uttar Pradesh: Budget breakdown for 5 non-attainment cities (NACs) from Uttar Pradesh was provided as part of the RTIs filed under the NCAP Tracker project in late 2019. These cities are Lucknow, Varanasi, Agra, Prayagaraj and Kanpur which have a combined air pollution management budget of ₹50 crores. Almost 50% of this budget amounting to ₹24.7 crores has been assigned for pollution clean up activities like mechanical street sweepers, demolition and construction waste management, water sprinklers etc. Pollution mitigation had a budget of ₹6.47 crores, which include measures like tree plantation, supply of gas based tandoors and burners and mobile enforcement units. Monitoring network has been assigned ₹16 crores which will lead to 12 CAAQMS stations in these 5 cities and 2 source apportionment studies.
Maharashtra: As per RTI’s filed as part of the Budget Dashboard for the NCAP Tracker project, ₹40 crores have been assigned by 4 non-attainment cities in Maharashtra – Mumbai, Navi Mumbai, Pune and Nagpur. Pollution clean up activities have been assigned 50% of this budget amounting to ₹20 cr, out of which another 11 crores are allotted for mechanical street sweepers. Installation of 6 CAAQMS monitoring station has been assigned ₹7.2 crores and pollution mitigation measures have a budget of ₹6 crores. Mitigation activities include electric/gas based crematorium, proper collection and disposal of horticultural waste and traffic synchronization system.
Chhattisgarh: An RTI filed earlier this earlier and included in the Budget Dashboard of the NCAP Tracker establishes that Bhilai and Raipur received a budget of ₹20 crores, out of which ₹7.6 crores were allocated to pollution mitigation measures which included green paving activities. ₹6.3 crores were assigned to pollution clean-up measures like water sprinklers, mechanical street sweepers and mobile enforcement units. Monitoring coverage has been allotted ₹5.6 crores which are being used to install 4 CAAQMS monitoring stations and conduct one source apportionment study.
About The Author
You may also like
Delhi-NCR most polluted region in India, Karnataka the cleanest air in India: Report
Outdoor air quality chronically underfunded, finds State of Global Air report
PM2.5 shortening average life expectancy of Delhi residents by almost 12 years
PM 2.5 air pollution increases anti-biotic resistance globally, India risk increases 2.5%
Green court forms panel to release air pollution control norms around hospitals with in the next 3 months